
Monitor with Prometheus
Learn how to monitor a cluster using Prometheus.
To monitor a Pachyderm cluster with Prometheus, a Enterprise License is required.
Pachyderm’s deployment manifest exposes Prometheus metrics, allowing an easy set up of the monitoring of your cluster. Only available for self-managed deployments today.
These installation steps are for Informational Purposes ONLY. Please refer to your full Prometheus documentation for further installation details and any troubleshooting advice.
Prometheus installation and Service Monitor creation #
1. Install Kube-Prometheus-Stack #
You’ll need to install the kube-prometheus-stack, Prometheus’ Kubernetes cluster monitoring using the Prometheus Operator.
- Get repo info.
helm repo add prometheus-community https://prometheus-community.github.io/helm-charts
helm repo update
- Install the Prometheus-operator Helm chart.
helm install <a-release-name> prometheus-community/kube-prometheus-stack2. Create a ServiceMonitor for Pachyderm in Kubernetes #
- Create a
myprometheusservice.yamlfile with the following:
apiVersion: monitoring.coreos.com/v1
kind: ServiceMonitor
metadata:
  name: pachyderm-scraper
  labels:
    release: <a-release-name>
spec:
    selector:
        matchLabels:
          suite: pachyderm
    namespaceSelector:
        matchNames:
        - default
    endpoints:
    - port: prom-metrics
interval: 30s- Create a ServiceMonitor looking to scrape metrics from
suite: pachyderm:
kubectl create -f myprometheusservice.yamlThe prometheus-operator will search for the pods based on the label selector <a-release-name>
and creates a prometheus target so prometheus will scrape the metrics endpoint prom-metrics.
In this case, it looks for anything with the label suite: pachyderm - which is by default associated with all Pachyderm resources.
Our Service Monitor pachyderm-scraper above maps the endpoint port prom-metrics
to a corresponding prom-metrics port described in Pachyderm’s deployment manifest.
Let’s take a quick look at this file:
kubectl -o json get service/pachdIn the json file, find:
   {
   "name": "prom-metrics",
   "port": 1656,
   "protocol": "TCP",
   "targetPort": "prom-metrics"
   }
Port-Forward #
Connect to Prometheus using the following command:
kubectl port-forward service/<release-name>-kube-prometheus-prometheus 9090If you have an existing Prometheus deployment, please navigate to your Prometheus GUI.
Browse #
You can now browse your targets (http://localhost:9090/targets).
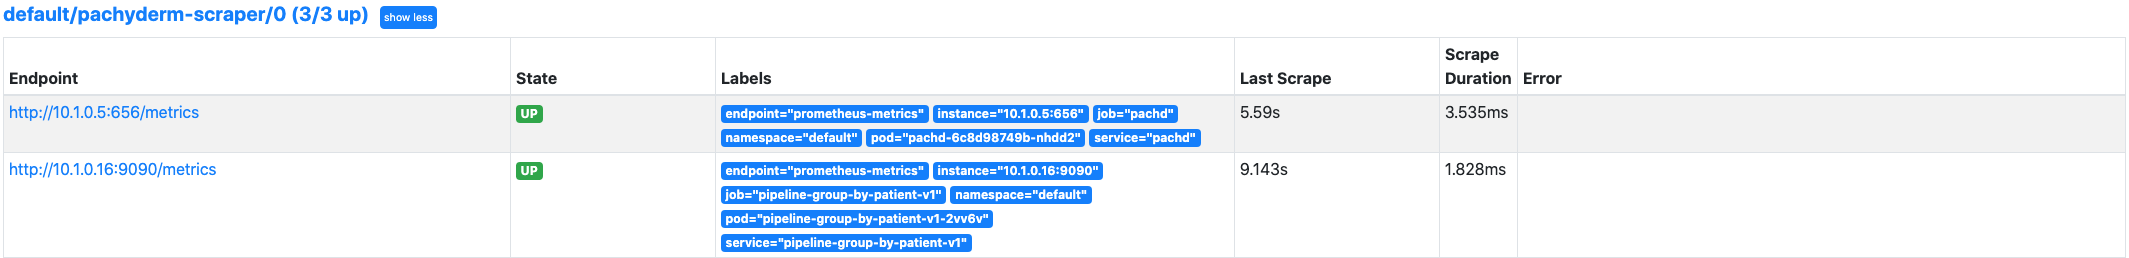
Run a pipeline of your choice. The pachyderm-scraper should be visible:
In the ClassicUI tab, you should be able to see the new Pachydermmetrics.